Debugging Blackboard Applications using Xilinx SDK’s Debugger
Overview of the XSDK Debugger

Introduction
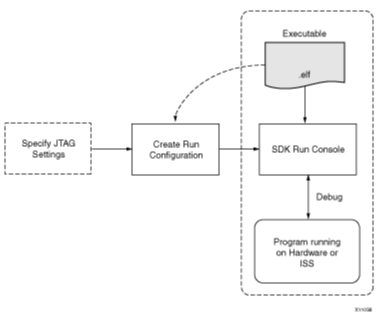
Real Digital’s Blackboard has a Zynq-7000 series SoC that has a JTAG Debugger, which allows the SDK to stop your application at any given point you choose. Xilinx’s SDK has a debugger, which allows you to see what is happening to a program while it executes. You can do this by setting breakpoints to stop the processor at a given line of code, step through program executions, view the program variables and stack, and view the registers of the memory in the system itself. As stated in Xilinx®’s Documentation “The SDK debugger uses the GNU Debugger (GDB) with Xilinx® Microprocessor Debugger (XMD) as the underlying debug engine. It translates each user interface action into a sequence of GDB commands and processes the output from GDB to display the current state of the program being debugged. It communicates to the processor on the hardware and ISS target using XMD.” You can see the debug workflow acquired from Xilinx®’s Documentation in the figure below
This tutorial will walk you through a sequence of steps on how you can use some of the main functionalities of this debugger. After going through this tutorial you can explore the debugger on your own to better understand how to use it. Throughout any future Real Digital Projects, you may find it useful to use the SDK Debugger to complete your projects successfully.
Step 1: Show Line Numbers, Set Breakpoints, and Start the Debugger
Show Line Numbers
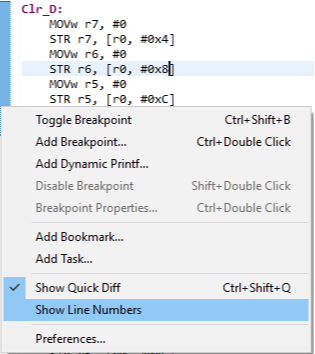
You might find it useful to have the SDK show you the line numbers of your code. If by default you can’t see the line numbers, you can configure them to be on by right clicking the left side bar of your code and click on “Show Line Numbers,” as shown in figure 2.
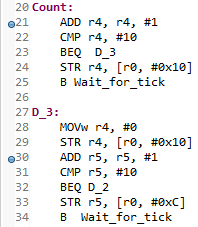
Set Breakpoints
You can set breakpoints onto any line of your code by simply double-clicking on the left side of that line of code. Breakpoints are simply points that mark where the application will stop. Figure 3 shows the breakpoints used for this example that are set to lines 40 and 45 (your line numbers may differ); thus, the application will stop at these lines when the debugger is running. You can remove the breakpoints the same way as you set them.
Start the Debugger
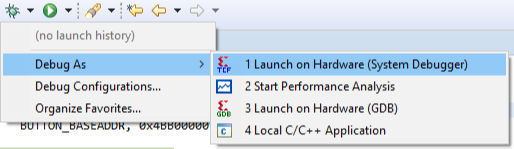
Next, make sure you have programmed your FPGA before proceeding with this step. Now, launch the debugger by clicking on the small arrow next to the debug icon  . A drop-down menu opens where you need to select Debug As and then click on Launch On Hardware (System Debugger), as shown in figure 4.
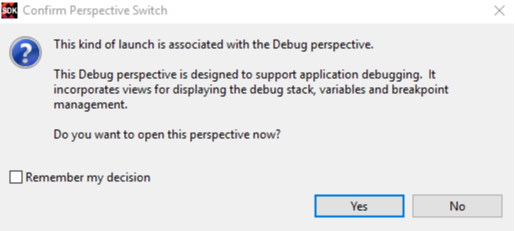
A Confirm Perspective Switch dialog pops up, click YES to switch to Debug perspective.
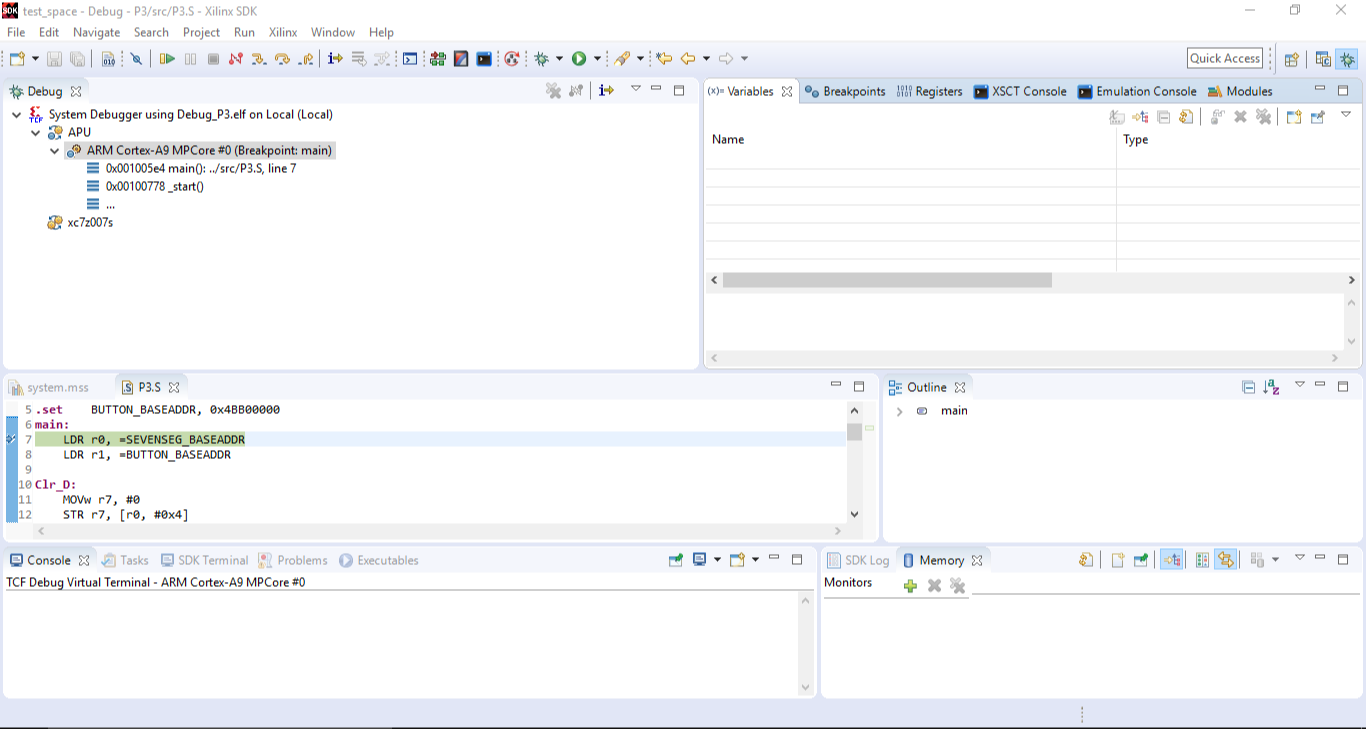
Step 2: Explore the Debug Perspective
Your SDK perspective has changed to something similar as shown in figure 6. You’ll notice several new dialogs that opened, such as Debug, Variables, Outline, and Memory. PS! You may switch back to regular C/C++ window view by clicking the  icon on the top right corner from the Quick Access toolbar
 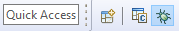 , the same way you can enter back to the debug mode.
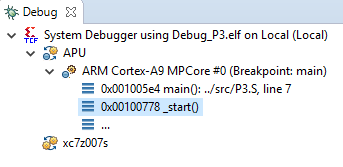
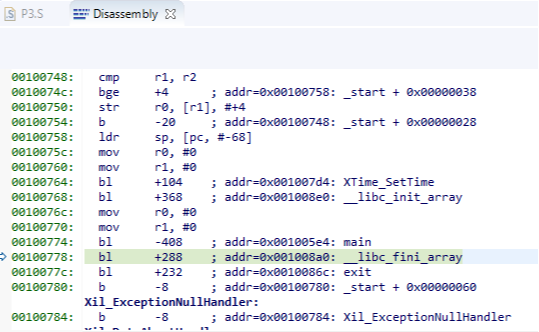
Debug Perspective: Disassembly
Under the Debug window you can click on 0x001007f0 _start() and a Disassembly window will open.
Disassembly window will appear, which allows you to view disassembly code mixed with source information.
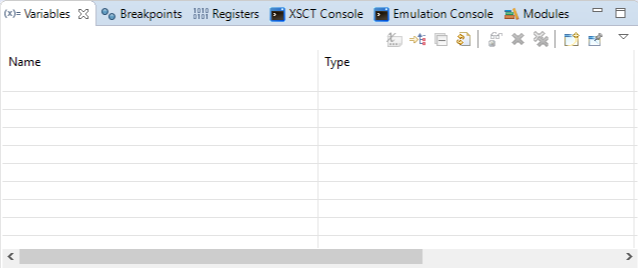
Debug Perspective: Variables, Breakpoints, Registers, Consoles, and Modules
Next, look at the Variables tab. If your program has global variables, then those will appear there.
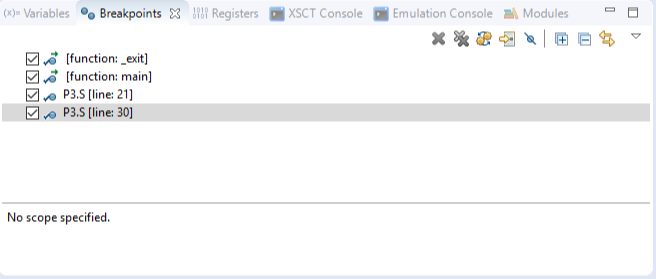
Now, click on the Breakpoints tab to see which breakpoints have been enabled within your code.
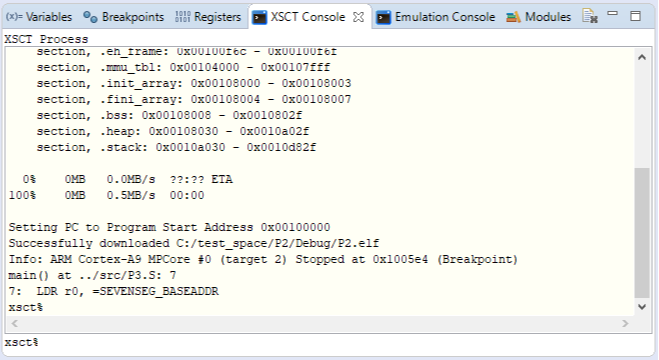
Xilinx Software Command-Line Tool (XSCT) Console is an interactive and scriptable command-line interface. Refer to UG1208 Documentation for more information on scripting in XSCT. XSCT is typically meant for advanced users. You can also notice that XSCT allows you to see the sections setup in the linker script, more information about setting up stack and other memory locations for your application can be found under TUTORIAL: Initializing the Stack
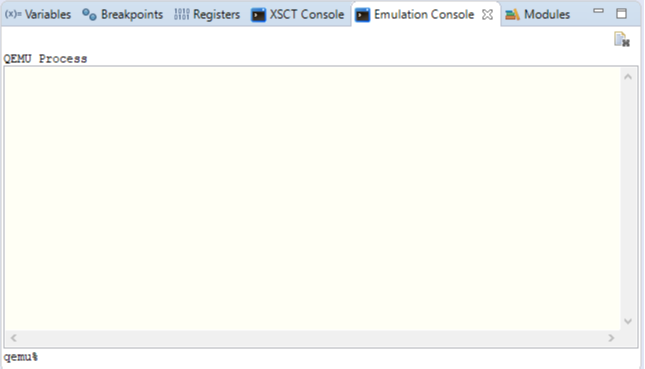
Next, the emulation console is used for scripting QEMU, which is a Functionally Accurate Virtual Emulation Platform. This would allow you to develop, debug, & run your software exactly as you would do on your Blackboard, just using your computer. You can watch an Introduction to QEMU and read more about QEMU in Xilinx®’s Documentation UG1169.
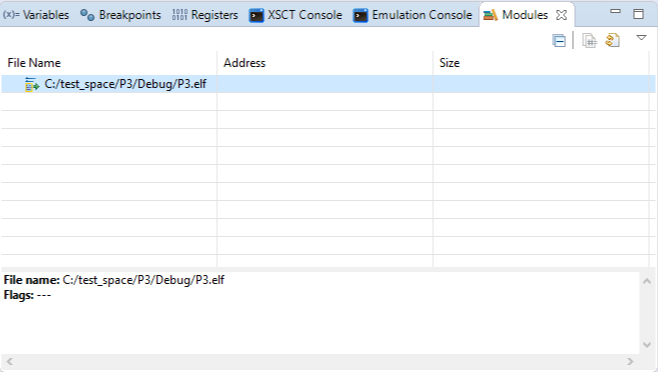
Under the modules tab you will simply find the “.elf” file used for the debugger.
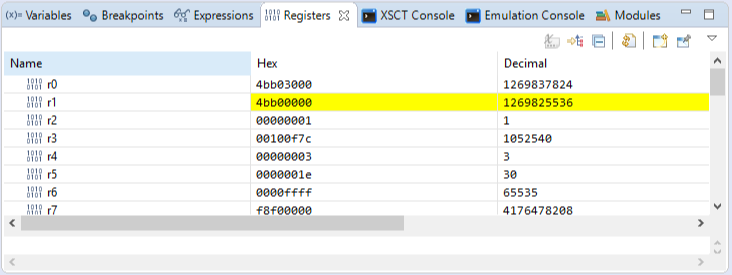
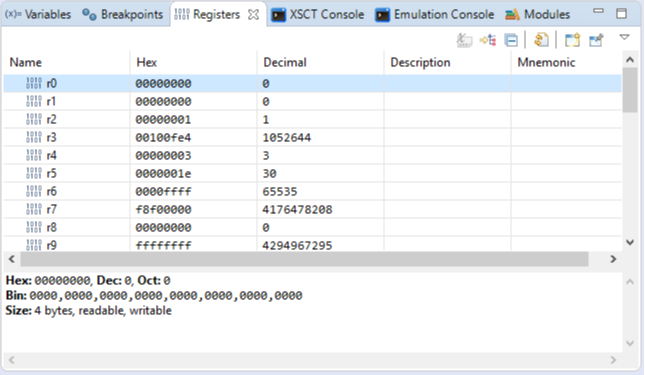
Click on the registers tab; you can find all the registers used and see their values changing as you run the debugger. When values change within the registers then those registers will be highlighted.
Debug Perspective: Outline
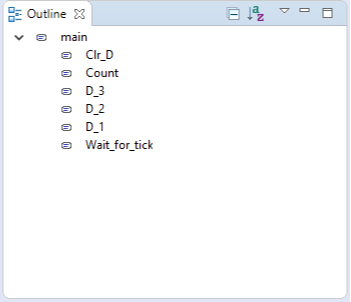
Go to the outline tab next and select the P3.S file from Debug window. You can click on the names of these functions, which will take you straight to that function in your assembly code.
Debug Perspective: Memory
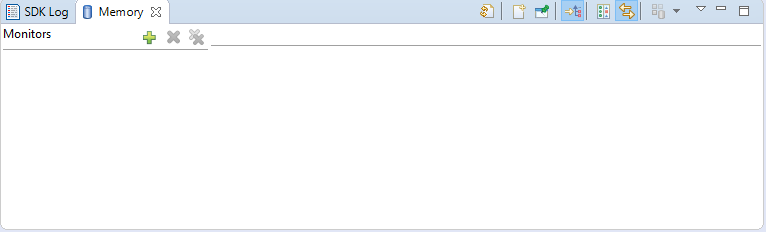
Next is the Memory window, which allows you to monitor the memory while you run your debugger.
Step 3: Add a Memory Monitor and a Watch Expression
Add a Memory Monitor
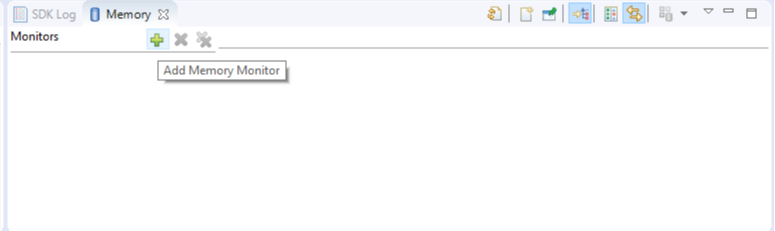
To add a Memory Monitor simply click on  as shown in the figure below:
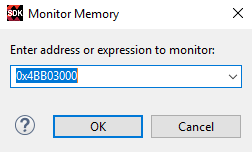
A Monitor Memory dialog will appear. Type in 0x4BB03000 which is the 7-Segment Display Module Base address and press OK.
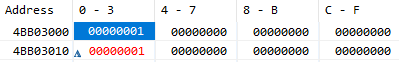
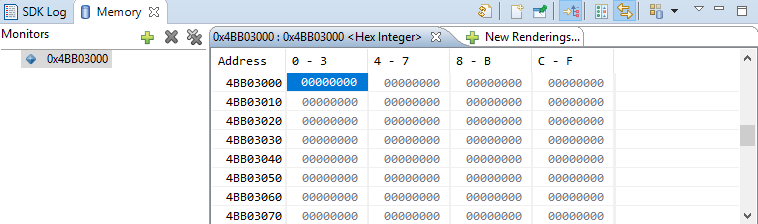
The Memory window has changed now and you can see all the memory addresses necessary as shown in figure 19.
Add a Watch Expression
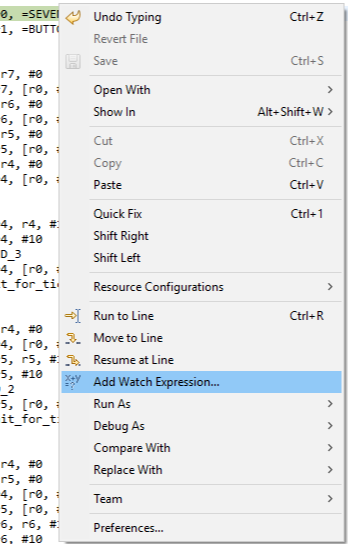
Next, add a watch expression by right clicking anywhere in your main.S file and select add watch expression. A watch expression is simply a special breakpoint that stops the execution of your application whenever the given expression changes, without specifying where this may occur.
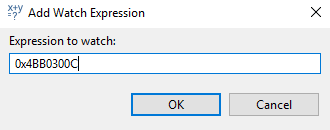
An Add Watch Expression dialog pops up and add a watch expression to 0x4BB0300C (digit 3 of 7-Segment Display). Click OK.
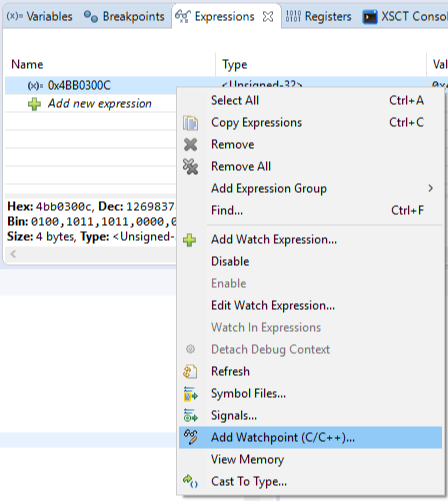
You’ll notice that another window appeared as you added the watch expression. Right click on the name of the expression and select Add Watchpoint. Adding a watchpoint gives you the ability to specify the condition when will be the execution of your application stopped.
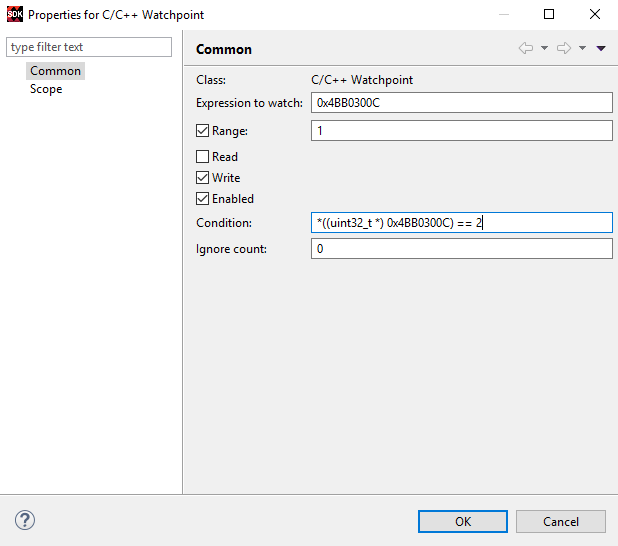
Now, set *((uint32_t *) 0x4BB0300C) == 2 as the condition and make sure you select “Write” which causes the watchpoint to happen ONLY when integer 2 is the written value in 0x4BB0300C register. You may add as many watch expressions and watchpoints as you need, you may also add different conditions if you want to.
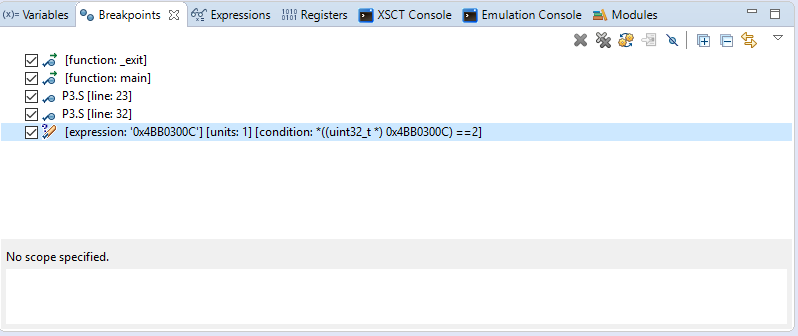
You can go to Breakpoints tab to see that you have another breakpoint (watchpoint) with a specific condition added to the list. You may remove any breakpoints here as you wish.
Step 4: Quick Access Functionalities
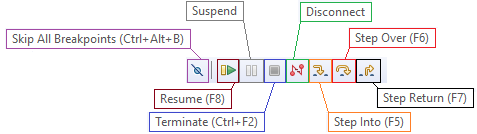
Now go to the top toolbar where you’ll find some quick access functionalities to debug your application as shown in figure 24. Resume, Suspend, Terminate, and Disconnect are commands used to control the debug execution. Step into, Step Over, and Step Return are single step functions.
- Skip All Breakpoints allows you to skip all the breakpoints.
- Resume is used to resume the regular flow of your program until a breakpoint/watchpoint is encountered.
- Suspend can be used to pause regular flow of your program.
- Terminate is used to terminate your program.
- Disconnect will disconnect the interface between the debugger and your program.
- Step Into can be used to enter the (lower hierarchy function), this means that you can enter a sub-function from your “main” function or the disassembly code that was introduced earlier.
- Step Over allows you to stay at the same hierarchy of functions and step over a line of code.
- Step Return can be used to enter back to the higher hierarchy function, so you can go from the sub-function back to the main function.
Put some of these commands into practice and see what happens to the registers in memory. Press  to run your deubgger from one breakpoint to another or to the next upcoming watchpoint; you can use Step functionalities to go through your debugger one line at a time. When you Step through your program, you might see some changes happening to your Registers or Memory locations as shown in figure 26 and 27, respectively.